"Why is our hot storage at 95% capacity?"
I looked at their Splunk environment. 30 TB of storage across the cluster. Plenty of space.
Except 90% of it was in cold buckets. Hot storage had 48 hours until complete failure.
Understanding Splunk's Bucket Strategy
Splunk data moves through a lifecycle:
- Hot buckets: Currently being written to (fast SSD storage)
- Warm buckets: Rolled, no longer written (fast SSD storage)
- Cold buckets: Older data, infrequently searched (slower SATA storage)
- Frozen buckets: Archived or deleted
The problem? Most teams set this up once during installation and never revisit it. Then data patterns change, volume grows, and suddenly hot storage fills up.
Real Case: The STIG Disaster
One of my early projects involved a Splunk environment where someone had implemented STIG requirements too aggressively. They set the minimum free disk space to 50%.
Splunk hit that threshold and stopped indexing—even though 12 TB of space was still available.
Users started calling: "Data isn't showing up in searches."
Security team panicked: "Are we under attack?"
Reality: Bad storage configuration, not a breach.
We overrode the STIG setting to something practical (15% minimum free space). Indexing resumed immediately.
The Three Configuration Mistakes
1. Not Using Separate Volumes for Hot/Warm vs. Cold
Many teams put all buckets on the same volume. This means:
- Expensive SSD storage gets wasted on cold buckets
- Cold storage can fill up hot volume
- No way to prioritize fast vs. cheap storage
Correct approach:
[volume:hot_warm]
path = /mnt/fast_ssd/splunk_hot_warm
maxVolumeDataSizeMB = 500000

[volume:cold]
path = /mnt/cheap_sata/splunk_cold
maxVolumeDataSizeMB = 10000000
2. Setting Max Bucket Size Too Small
Default: 750 MB per bucket (auto)
Some teams set this to 100 MB thinking "smaller buckets = better performance."
Wrong. This creates:
- Excessive number of small files
- File system inode exhaustion
- Slower searches (more buckets to check)
I recently worked on an environment with 450,000 buckets because maxDataSize was set to 50 MB. Searches were painfully slow. We increased to 1 GB and bucket count dropped to 22,000. Search performance improved 300%.
3. Not Planning for Growth
Today's 1 GB/day can become tomorrow's 100 GB/day. I've seen:
- Marketing campaign launches → 10x log volume overnight
- New applications onboarded → unexpected data sources
- Compliance requirements → longer retention = more storage
Always provision storage for 3x current daily volume. If you're ingesting 100 GB/day, plan for 300 GB/day capacity.
The Storage Formula
Here's how I calculate storage requirements:
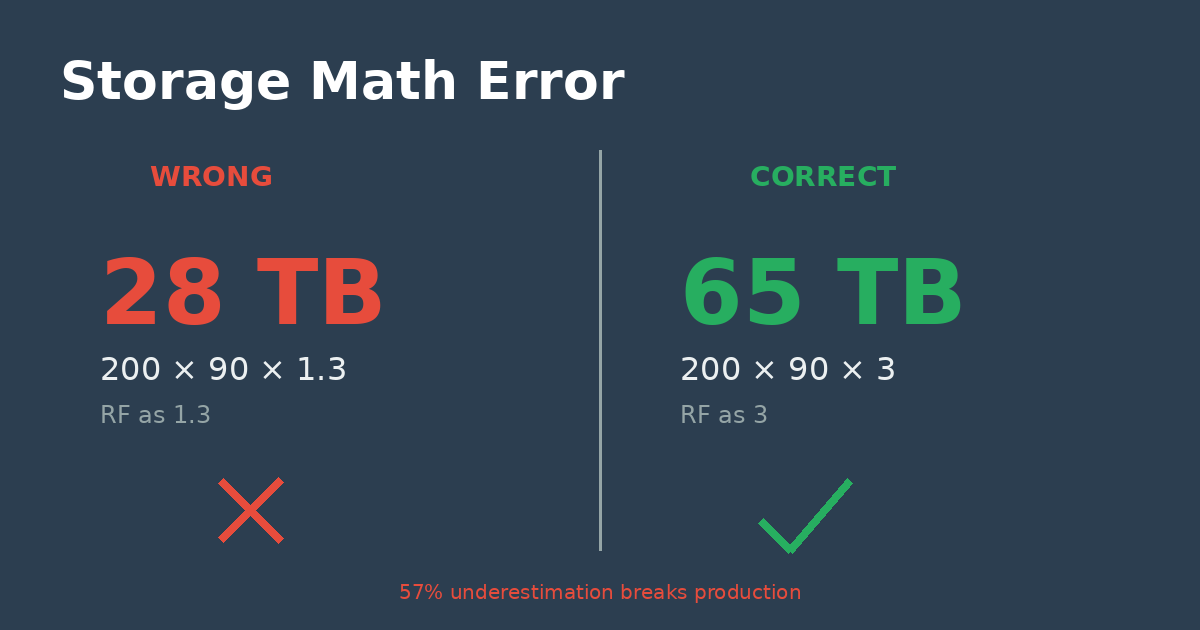
Daily Ingest (GB/day) × Retention (days) × RF (replication factor) × 1.2 (buffer) = Total Storage NeededExample:
- 200 GB/day ingest
- 90 days retention
- Replication factor 3
- 20% buffer for growth
200 × 90 × 3 × 1.2 = 64,800 GB = ~65 TB
The Monitoring You Need
Set up alerts for:
Hot/Warm Storage Capacity:
| rest splunk_server=local /services/server/status/partitions-space | eval pct_used=round((1-(free/capacity))*100, 1) | where pct_used > 80 | table splunk_server title capacity free pct_usedCold Storage Capacity:
| dbinspect index=* | stats sum(sizeOnDiskMB) as size_mb by index state splunk_server | where state="cold" | eval size_gb=round(size_mb/1024, 2) | sort -size_gbBucket Aging Issues:
index=_internal source=*splunkd.log "Not rolling" OR "Not freezing" | stats count by hostI run these searches daily. When storage hits 80%, I have at least a week to add capacity before hitting critical levels.
The Index-Level Optimization
Not all indexes need the same retention. I use tiered retention:
[security_critical]
homePath = volume:hot_warm/security_critical/db
coldPath = volume:cold/security_critical/colddb
maxDataSizeMB = 1024
frozenTimePeriodInSecs = 31536000  # 365 days

[debug_logs]
homePath = volume:hot_warm/debug_logs/db
coldPath = volume:cold/debug_logs/colddb
maxDataSizeMB = 512
frozenTimePeriodInSecs = 604800  # 7 days
Security logs: 1 year retention
Debug logs: 7 days
This prevents debug noise from consuming storage needed for critical security data.
The Cleanup Script
For indexes with excessive retention, set the proper retention policy in indexes.conf:
[old_app_logs]
frozenTimePeriodInSecs = 7776000
# 90 days = 90 * 24 * 60 * 60 = 7,776,000 seconds
# Data older than this will automatically roll to frozen
To identify candidates for retention adjustment:
| dbinspect index=old_app_logs | eval age_days=round((now()-endEpoch)/86400, 0) | where age_days > 90 | stats sum(sizeOnDiskMB) as recoverable_mb count as bucket_count by splunk_serverThe Takeaway
Storage problems in Splunk are never sudden. They're always predictable, always preventable, and always fixable—if you're monitoring proactively.
If you're not monitoring storage capacity daily, you will eventually have an incident. It's not "if," it's "when."
Have you dealt with storage disasters in Splunk? Share your story below.
I publish a new Splunk article every week. Follow me to catch the next one.