The call came in at 2 PM on a Tuesday.
"Marcus, our security dashboard hasn't updated since this morning. Are we under attack?"
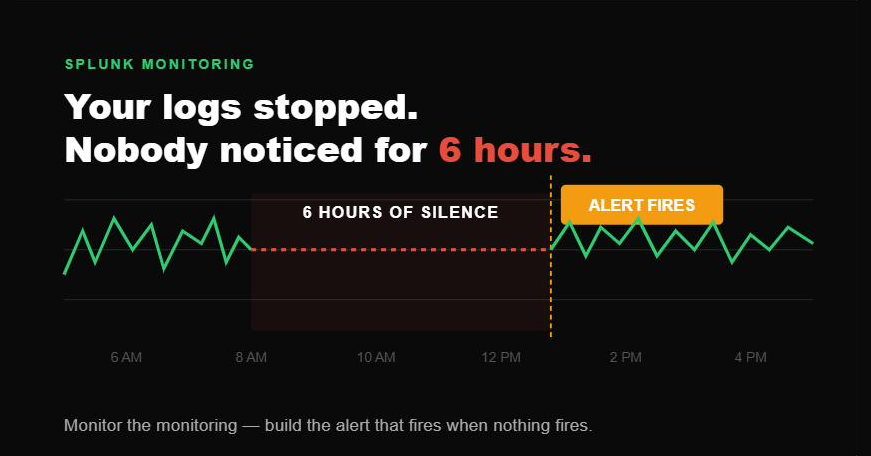
We weren't under attack. We had stopped collecting logs 6 hours earlier. Nobody noticed until an analyst spotted a frozen dashboard.
Six hours of blind spot. In a Federal environment. On a Tuesday afternoon.
Why Log Stoppage Is Worse Than It Sounds
When Splunk stops receiving data from a source, it doesn't fail loudly. Dashboards don't go red. Alerts don't fire. Everything looks normal — because the last known state was normal.
Your SOC is monitoring. Your dashboards are running. Your scheduled reports are executing. But the data feeding all of it stopped hours ago.
This is the silent failure mode that keeps me up at night more than any other.
The Four Reasons Logs Stop
After 20+ years of engineering experience, including 7 years designing and optimizing large-scale Splunk deployments in Federal and DoD environments, I've seen log stoppage trace back to four root causes every single time:
- The source stopped generating events — Application restart, service crash, or configuration change at the source. Splunk can't collect what isn't there.
- The forwarder stopped collecting — Universal forwarder service crashed, disk filled up, or network connectivity dropped. The source is generating events but nothing is picking them up.
- The indexer stopped receiving — Network issue between forwarder and indexer, firewall rule change, or certificate expiration blocking the connection.
- Retention expired prematurely — Data arrived but was aged out faster than expected due to misconfigured retention policies. Events existed briefly then disappeared.
Each failure point requires a different fix. Finding which one broke is the first job.
The Monitoring Gap
Most teams monitor what Splunk finds. Almost no one monitors whether Splunk is finding anything at all.
This is the gap. You have 200 alerts configured. Every single one of them fires based on data arriving. None of them fire when data stops arriving.
You're monitoring the monitoring — but only when it's working.
Building the Alert
The fix is a scheduled search that detects silence. For each critical source, you establish a baseline: this source normally sends at least X events per hour. When that threshold isn't met, fire an alert.
Here's the SPL pattern:
index=your_index sourcetype=your_sourcetype earliest=-2h latest=-1h
| stats count as event_count
| where event_count < 100
| eval message="Log stoppage detected — fewer than 100 events in last hour"
Adjust the threshold to match your environment's normal volume. Run it every 30 minutes. Alert immediately — not daily digest.
For environments with multiple sources, build a lookup table of expected minimums per sourcetype and join against it. One search covers your entire data pipeline.
The Rule That Changed How I Build Environments
After the Tuesday incident, I implemented one rule across every environment I touch:
Every critical data source gets a stoppage alert before it gets any other alert.
Detection capability is worthless if the data feeding it goes silent. The first alert you configure isn't for threats — it's for silence.
Monitor the monitoring. Build the alert that fires when nothing fires.
If you're building continuous compliance monitoring alongside your detection stack, the Compliance Posture app for Splunk tracks CIS benchmark posture trending inside your SIEM — so compliance gaps don't go unnoticed any longer than log stoppages should. It's free on Splunkbase: splunkbase.splunk.com/app/8501
Have you been caught off guard by log stoppage in your environment? What was the root cause? Drop it in the comments.
P.S. .conf2026 is this September and I'll be there. If you'd like to connect in person — drop me a message and let's set up a time to meet.
═══════════════════════════════════════════════════════════════════════════════
───────────────────────────────────────────────────────────────────────────────
───────────────────────────────────────────────────────────────────────────────